Practical guide for charting and interpreting the visual color fields
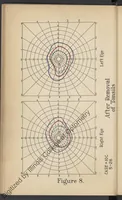
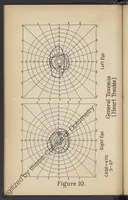
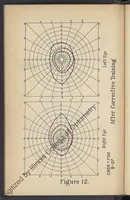
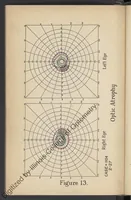
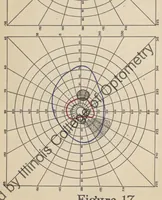
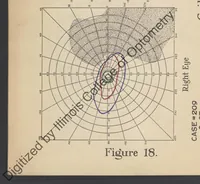
A 1928 optometry manual by William Arthur Mendelsohn, published by the Professional Recording Company, teaching practitioners how to chart and read visual field perimetry. Its pictures are paired plotted charts of left and right eyes, drawn as polar grids with coloured concentric boundary curves, with captions naming conditions such as general toxemia, optic atrophy, and tonsil removal. A designer could take the radiating grid lines and nested colour contours as a compact graphic motif for mapping or radar-style data.