The comparative performance of an aviation engine at normal and high inlet air temperatures
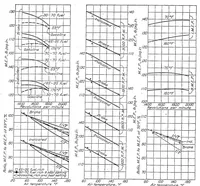
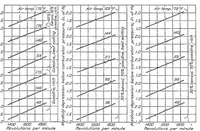
This is a 1928 NASA technical report, issued through the NASA Technical Reports Server, comparing how an aviation engine performs at normal and elevated inlet air temperatures, aimed at engineers and researchers. The pictures are dense engineering line graphs plotting mean effective pressure, horsepower, fuel consumption and air temperature against revolutions per minute, with labelled curves for several temperatures in black and white, offering a designer little beyond a stark, data-driven grid vocabulary of axes, ticks and stepped curve families.