Three methods of calculating range and endurance of airplanes
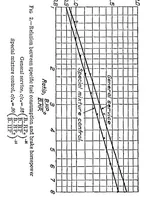
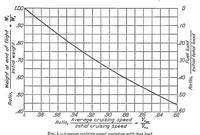
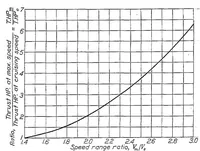
A 1927 NASA technical report on calculating airplane range and endurance, its figures are engineering charts of performance ratios rather than illustrations. The first chart plots thrust horsepower ratio against speed range ratio as a rising curve, the second plots weight ratio against cruising speed ratio and fuel load on a falling line, and the third plots specific fuel consumption against brake horsepower ratio for two mixture controls. A designer might take from them a clean, minimal graph style with thin black curves, fine grid lines and small serif axis labels.