Some aspects of the comparison of model and full-scale tests
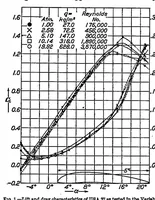
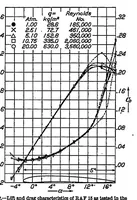
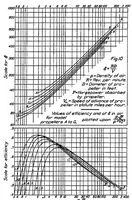
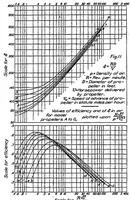
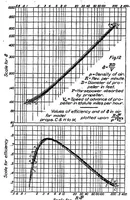
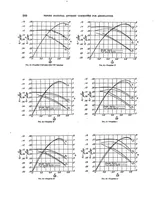
This is a 1926 technical report from the NASA Technical Reports Server, a scientific paper comparing wind-tunnel model propeller and airfoil tests against full-scale results for aeronautical engineers. The pictures are plain engineering charts: log-scale graphs of propeller efficiency and coefficient curves in labelled families, plus a lift and drag plot for the RAF 15 airfoil at several air densities. A designer might take from them the look of dense technical plotting, with fine grid lines, multiple curve families and small annotated labels.