The application of propeller test data to design and performance calculations
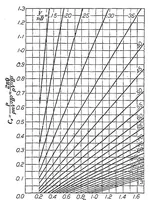
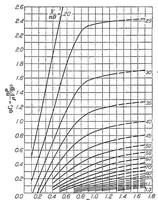
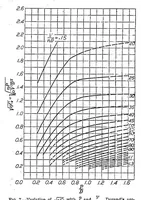
A 1925 NASA technical report, drawn from NACA-era records, presenting propeller test data for designers and engineers working on aircraft performance calculations. Its three pictures are engineering graphs of propeller coefficients plotted against pitch ratio and advance ratio, with families of labelled curves and dense square gridlines; a designer could borrow the clean, restrained chart language of dashed and solid curves, numbered contour labels and fine grid for diagrammatic or data-visualisation work.