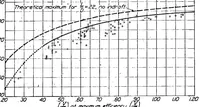
The general efficiency curve for air propellers
This is a 1924 technical report plotting propeller performance data, issued by NASA Technical Reports Server for engineers and aerodynamicists. The picture is a scatter chart with a theoretical maximum efficiency curve and a dashed lower boundary against a grid, with the horizontal axis labelled as an advance-ratio quantity and the vertical axis as efficiency. A designer could take from it a sparse, precise diagnostic chart style: thin dashed curves, open circle markers, and a faint squared grid suited to technical infographics.