Compression-ignition engine tests of several fuels
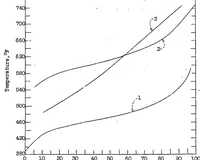
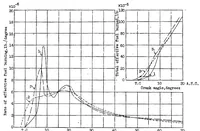
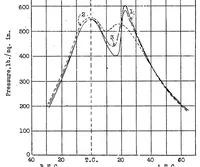
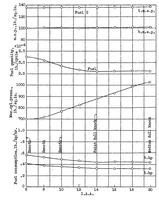
This is a 1932 technical report from the NASA Technical Reports Server, a set of compression-ignition engine test results comparing several fuels, prepared for engineers and combustion researchers. The four pictures are plain line graphs with black, grey and dashed curves labelled 1, 2 and 3 on gridded axes, plotting fuel burning rate, cylinder pressure, horsepower and fuel quantity against crank angle, and distillation temperature against percentage evaporated. A designer might take their clean rule-based chart style, numbered curve labelling and restrained monochrome palette as a model for technical data graphics.