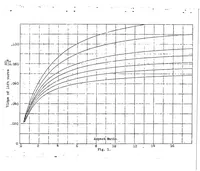
Effect of aerofoil aspect ratio on the slope of the lift curve
A 1922 NASA technical report chart, drawn as a plain engineering graph for aeronautics researchers, plotting the slope of the lift curve against wing aspect ratio. The single figure shows a family of rising curves over a fine grid, with the vertical axis labelled in lift-curve slope values and the horizontal axis labelled aspect ratio up to about 16. A designer could borrow its clean axis-and-grid layout and the gentle saturating curves as a restrained technical graphic.